| |
Periodic Trends

Introduction
Electrons are held in an atom
or ion by the electrostatic attraction between the positively charged
nucleus and the negatively charged electrons. In multi-electron species,
the electrons do not experience the full positive charge of the nucleus
due to shielding by electrons which lie between the electron of interest
and the nucleus. The amount of positive charge that actually acts on
an electron is called the effective nuclear charge.
Effective Nuclear Charge
The concept of effective
nuclear charge (Z*) is important to understanding periodic properties.
The effective nuclear charge is that portion of the total nuclear charge
that a given electron in an atom experiences. This is equal to the atomic
number (Z) minus the amount (σ) that other electrons in the atom
shield the given atom from the nucleus.
Z* = Z-σ
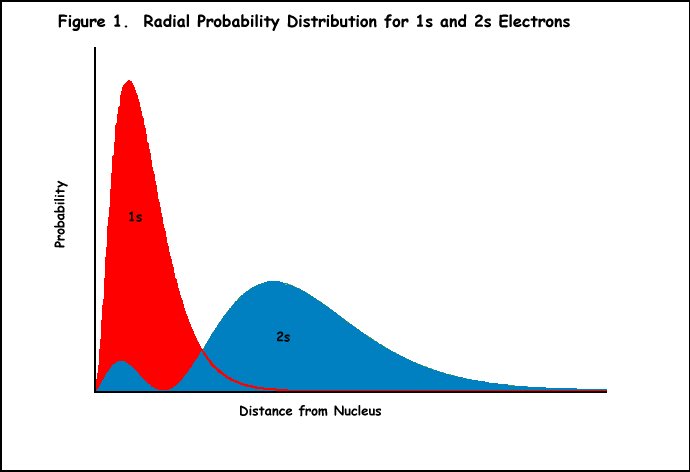
Example: Lithium has three
protons and an electron
configuration of 1s22s1. The electron in the
2s orbital is shielded from the full attraction of the protons by the
electrons of the 1s orbital (Figure 1). Thus, Z* felt by the 2s electron
should be one rather than three. However, lithium's 2s electron does
not behave as if it is experiencing exactly a +1 charge (Z* is actually
about 1.3 charge units). This can be explained by the fact that the
2s orbital has two maxima in its radial probability function (Figure
1), and the lesser maxima penetrates within the maximum of the inner
1s electron. Although lithium's 2s electron spends most of its time
in the outer lobe of that orbital feeling a nuclear charge of +1, some
of the time it is inside the 1s orbital experiencing the full nuclear
charge of +3. Thus, Z* is somewhat greater than +1.
Slater's Rules for Determining
σ
In 1930, J.S. Slater formulated
the following set of empirical rules for determining the values of the
shielding constant σ.
|
Slater's
Rules
|
-
Write out the electronic
configuration of the element and group the orbitals in the
following order:
(1s)(2s, 2p)(3s, 3p)(3d)(4s, 4p)(4d)(4f)(5s,
5p)........
- To establish the screening constant
for any electron, sum up the following contributions:
- Electrons in groups outside
(to the right) of the one being considered do not contribute
to the shielding.
- Electrons in the same group
contribute 0.35 to the shielding (except the 1s group,
where a contribution of 0.30 is used
- For s or p
electrons being observed, each electron in the (n-1) shell
contributes 0.85 to the shielding and each electron in
the (n-2), (n-3), ... shells contribute 1.00 to the shielding
- For d or f electrons
being observed, each electron in an underlying group contributes
1.00 to the shielding.
|
|
Example
|
|
Example: Calculate Z*
for a 4s and a 3d electron in Zn
Determine the electron
configuration for Zn
(1s)2(2s, 2p)8(3s,
3p)8(3d)10(4s)2
For a 4s electron:
Establish the screening constant for the 4s electron
σ = (1 x 0.35) + (18 x 0.85) + (10x1.00) = 25.65
Calculate the effective
nuclear charge
Z*= Z-σ = 30-25.65 = 4.35
For a 3d electron:
Establish the screening constant for the 3d electron 
Calculate the effective
nuclear charge
From
this example, you can see that the 3d electrons experience a
much greater positive charge than the 4s electron and would
be held more tightly. Thus, the 4s electrons will be the first
removed when Zn is ionized.
|
|
PROBLEMS
|
- Using Slater's rules, calculate
a value for the effective nuclear charge felt by (a) an electron
being added to the 3s orbital of a neon atom and (b)
an electron being ionized from the 2p orbital of the
neon atom.
 Comment on your results relative to the stability of the electron
configuration of the neon atom.
Comment on your results relative to the stability of the electron
configuration of the neon atom.
- Calculate Z* for the valence electrons
in the atoms Li to Ne using (a) the assumption that σ
equals the number of inner-shell electrons and (b) Slater's
rules. Plot both sets of results on the same graph and discuss.
- Recall why the energy of an ns
orbital is less than that of an np orbital. Use this
information to discuss the assumption that these orbitals are
always considered as a group (ns, np) in Slater's
rules.
- Plot of the probability of finding
3s, 3p, 3d and 4s electrons as a
function of the radial distance from the nucleus can be viewed
here.
Discuss these probabilities relative to rules 2c and 2d of Slater's
rules.
You can access a spreadsheet for calculating
effective nuclear charges here.
If you need assistance in using Excel for plotting data, try this
tutorial.
|
The Periodic Table
You have used the periodic
table throughout your study of chemistry. Read more about the periodic
table here. Mendeleev was one of the early
chemists to recognize that the properties of the elements were periodic
in nature. Read from Mendeleev's
original publication.
Periodic Trends
In the remainder of this module,
you will be analyzing the periodic trends that exist among the elements.
Start your investigation by viewing this movie
on periodic trends.
Atomic Radius
There are several ways to define
the atomic radius of an atom:
- covalent radius (rcov),
the half-distance between the nuclei of two atoms joined in a covalent
bond
- van der Waals radius (rvdw),
the half-distance between the nuclei of two atoms of neighboring
molecules
- metallic radius (rmet),
for metallic elements, the half-distance between the nuclei of two
neighboring atoms in the solid metal
The difference between covalent
radius and van der Waals radius is shown in Figure 2.
|
PROBLEMS
|
- Plot the values of radii vs. atomic
number for the Group 1A elements and the Period 2 elements.
you will find the
data that you need in this Excel spreadsheet
of physical property data for the elements (right clicking on
the link will allow you to save the file).
- Use the concept of effective nuclear
charge to rationalize the trend in radii values for the Group
1A elements.
- Use the concept of effective nuclear
charge to rationalize the trend in radii values for the Period
2 elements.
You can see a short movie depicting what
you should have concluded here. |
Ionization Energy
Recall that the ionization
energy (actually the first ionization energy) is the energy required
to remove an electron from the outermost occupied orbital of a gaseous
atom.
|
PROBLEMS
|
- Plot the ionization energies for
the first 86 elements of the periodic table versus atomic number.Display
your plot as both a normal graph and as a bar graph. Explain
the general trends that occur across a period and down a family
using the concept of effective nuclear charge. In each period
an anomaly to the general trend occurs with the Group 3A element
and the Group 6A element. Explain this anomalous behavior.
- Using Slater's rules, calculate
the Z* for Al, Al+, Al2+, and Al3+.
Discuss the results relative to the expected ionization energies
for these species.
- Calculate the Z* for the valence
ns electron of lithium, sodium, and potassium using the assumption
that σ equals the number of inner-shell electrons. Are
your results consistent with the trends in ionization energy
for these elements? Discuss why or why not.
|
Electron Affinity
Electron affinity is the change
in energy that occurs when an electron is added to a neutral, gaseous
atom.
|
PROBLEMS
|
|
Plot the electron affinity for Main
Group elements ( Group 1A-8A) versus atomic number.Display
your plot as both a normal graph and as a bar graph. Explain the
general trends that occur across a period and down a family using
the concept of effective nuclear charge. An anomaly to the general
trend occurs in a period in going from the Group 1A element to
the Group 2A element and in going from the Group 4A to Group 5A.
An anomaly can also be found between rows 2 and 3 in going down
a period. Give an explanation for each of these anomalies.
|
Electronegativity
Electronegativity is the ability
of an atom in a molecule to draw electrons
to itself.
|
PROBLEMS
|
|
Sketch
a periodic table, indicating the trend of electronegativities
from lowest to highest. Relate
these trends to effective nuclear charge and atomic size.
|
Other Trends
There are many properties for
which you can investigate periodic trends. There is a nice Excel spreadsheet
that allows you to look at the trends for various properties in 3-D.
Download the spreadsheet. This spreadsheet uses macros for accessing the plots. If you get a message that the macros have not downloaded because of the security setting, reset the security setting for Excel using the tools menu. You will need to enable editing and if asked, make it a trusted document.
|