![]()
 |
 |
 |
GIS stans for Geographic Information Systems which integrates hardware, software, and data for capturing, managing, analyzing, editing, and displaying all forms of geographically referenced information. the data is stored in two way: Raster and Vector.
Raster data is stored in a grids system of rows and columns making cells, with each cell storing a single value.
Vector data stored features as geometrical shapes in the from of Points, Lines or polylines, and Polygons.
Data is stored in coordinate systems, but not all data is stored in the some coordinate systems. You must us projections tool in GIS software to projection and some times conversions to different coordinate systems. Coordinate systems are base off of latitude, longitude, elevation for any given point on the Earth's surface. A projection is a mathematical means of transferring information from a model of the Earth, which represents a three-dimensional curved surface, to a two-dimensional medium—paper or a computer screen.
What can you do what GIS softwear like ESRI ( Environmental Systems Research Institute) and ArcGIS?
Make and trade date
Raster-to-vector translation
Projections, coordinate systems and registration
Spatial analysis
Data output and cartography
Graphic display techniques
With Spatial analysis you all sort of thing like:
Data modeling
Topological modeling
Networks
Cartographic modeling
Map overlay
Automated cartography
Geostatistics
Address Geocoding
Reverse geocoding
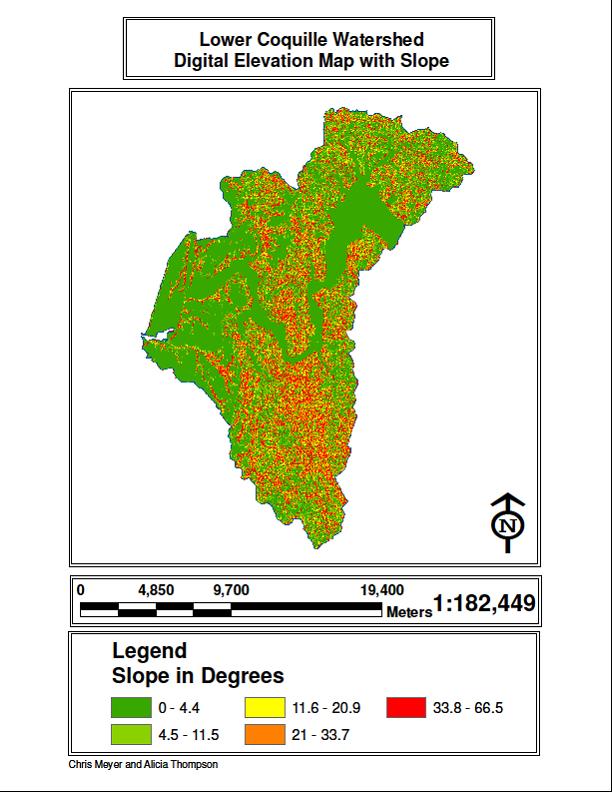
Slope and contour lines
Data File Formats
a. DEM Data *.dem
b. DRG Data *.tif *.tfw
c. Shapefile (vector, *.shp, *.dbf, *.shx)
d. ARC/INFO export file (*.e00) interchange format (vector or raster)
e. Arc/Info GRID (raster)
f. ArcGIS geodatabase (*.mdb)
g. OrthophotoQuads (MrSID, *.sid *.sdw)
Here What Me and a Classmate Did:
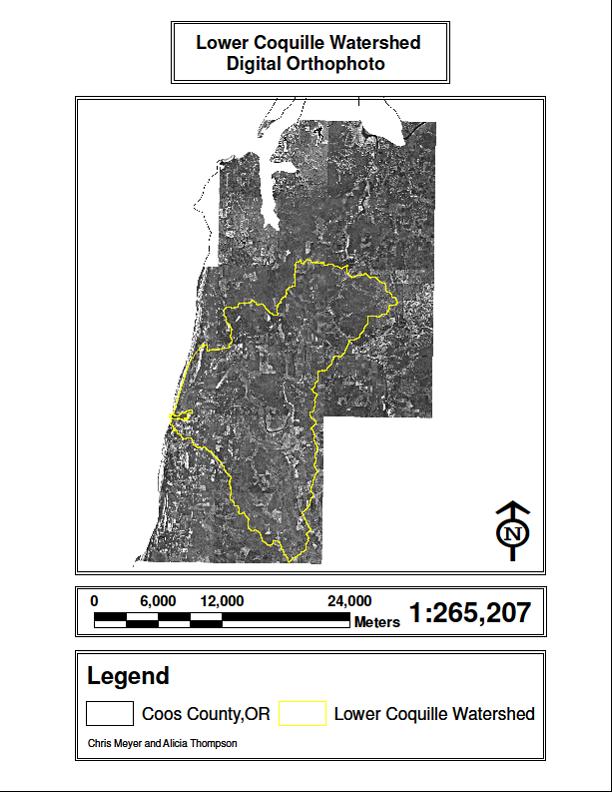
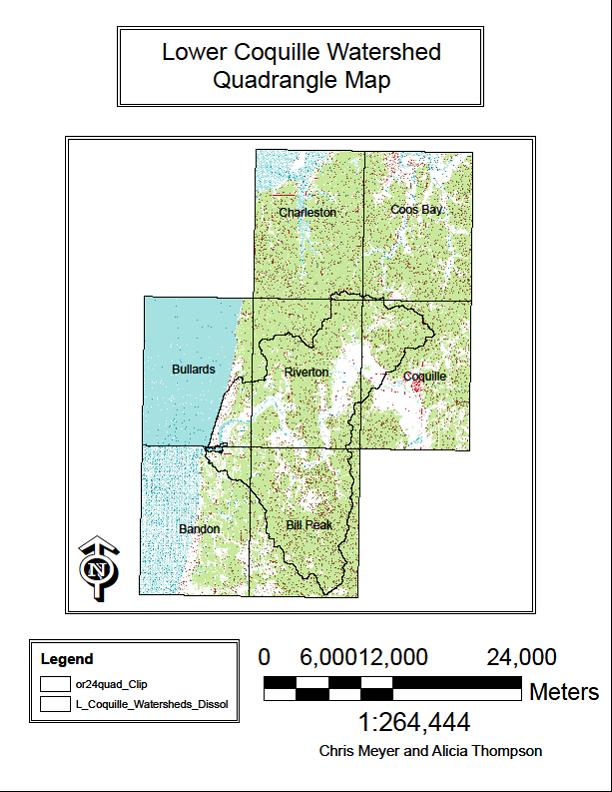
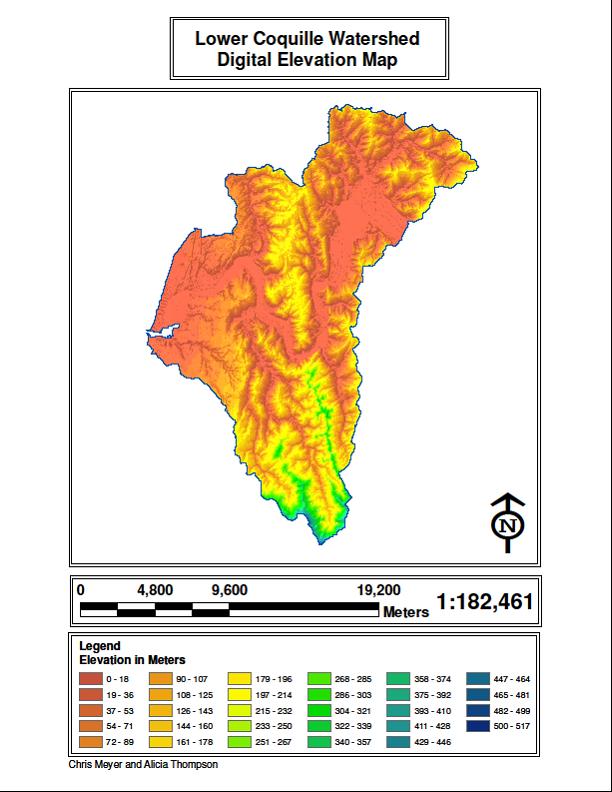
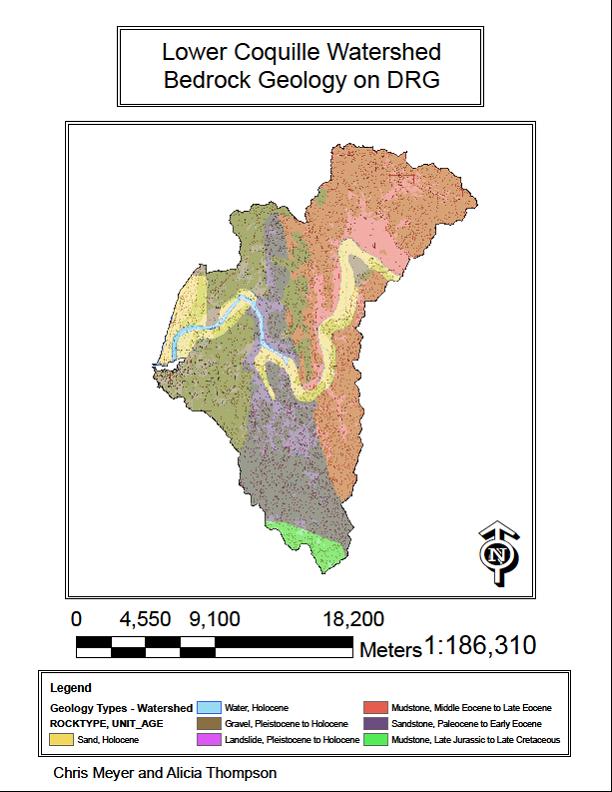
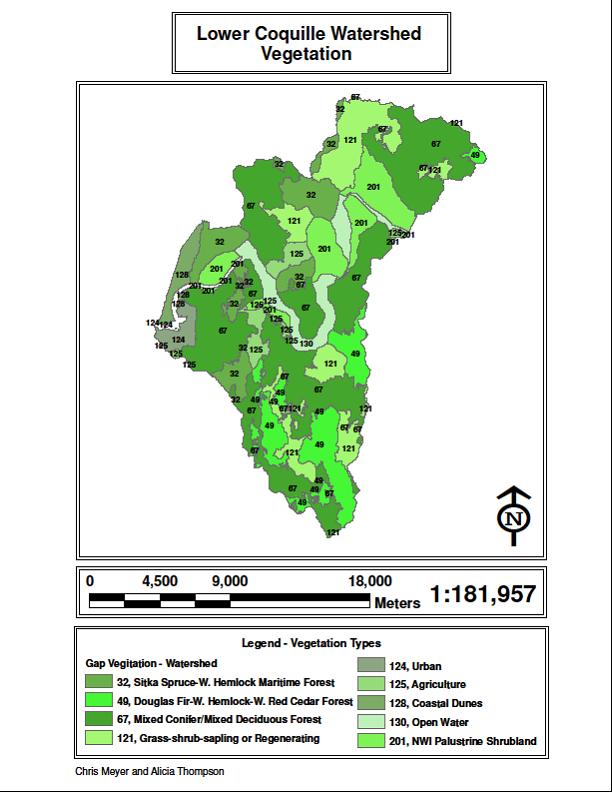
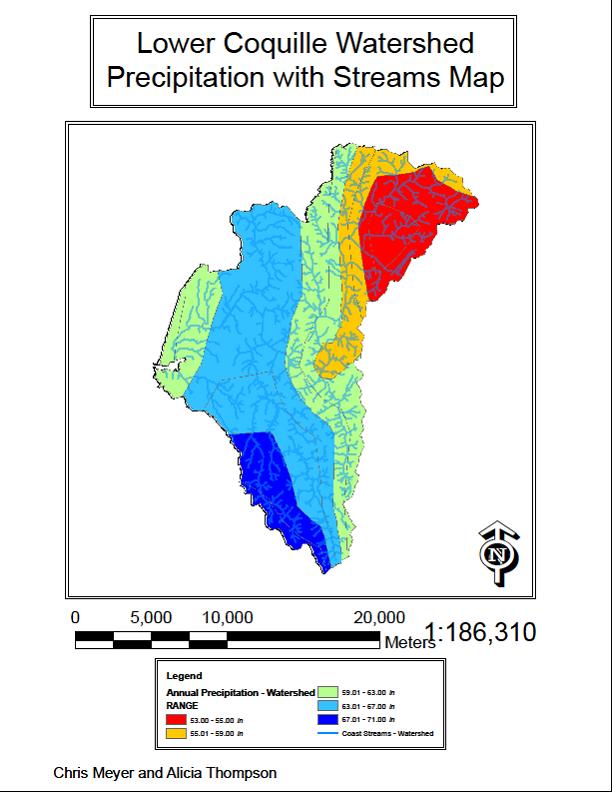
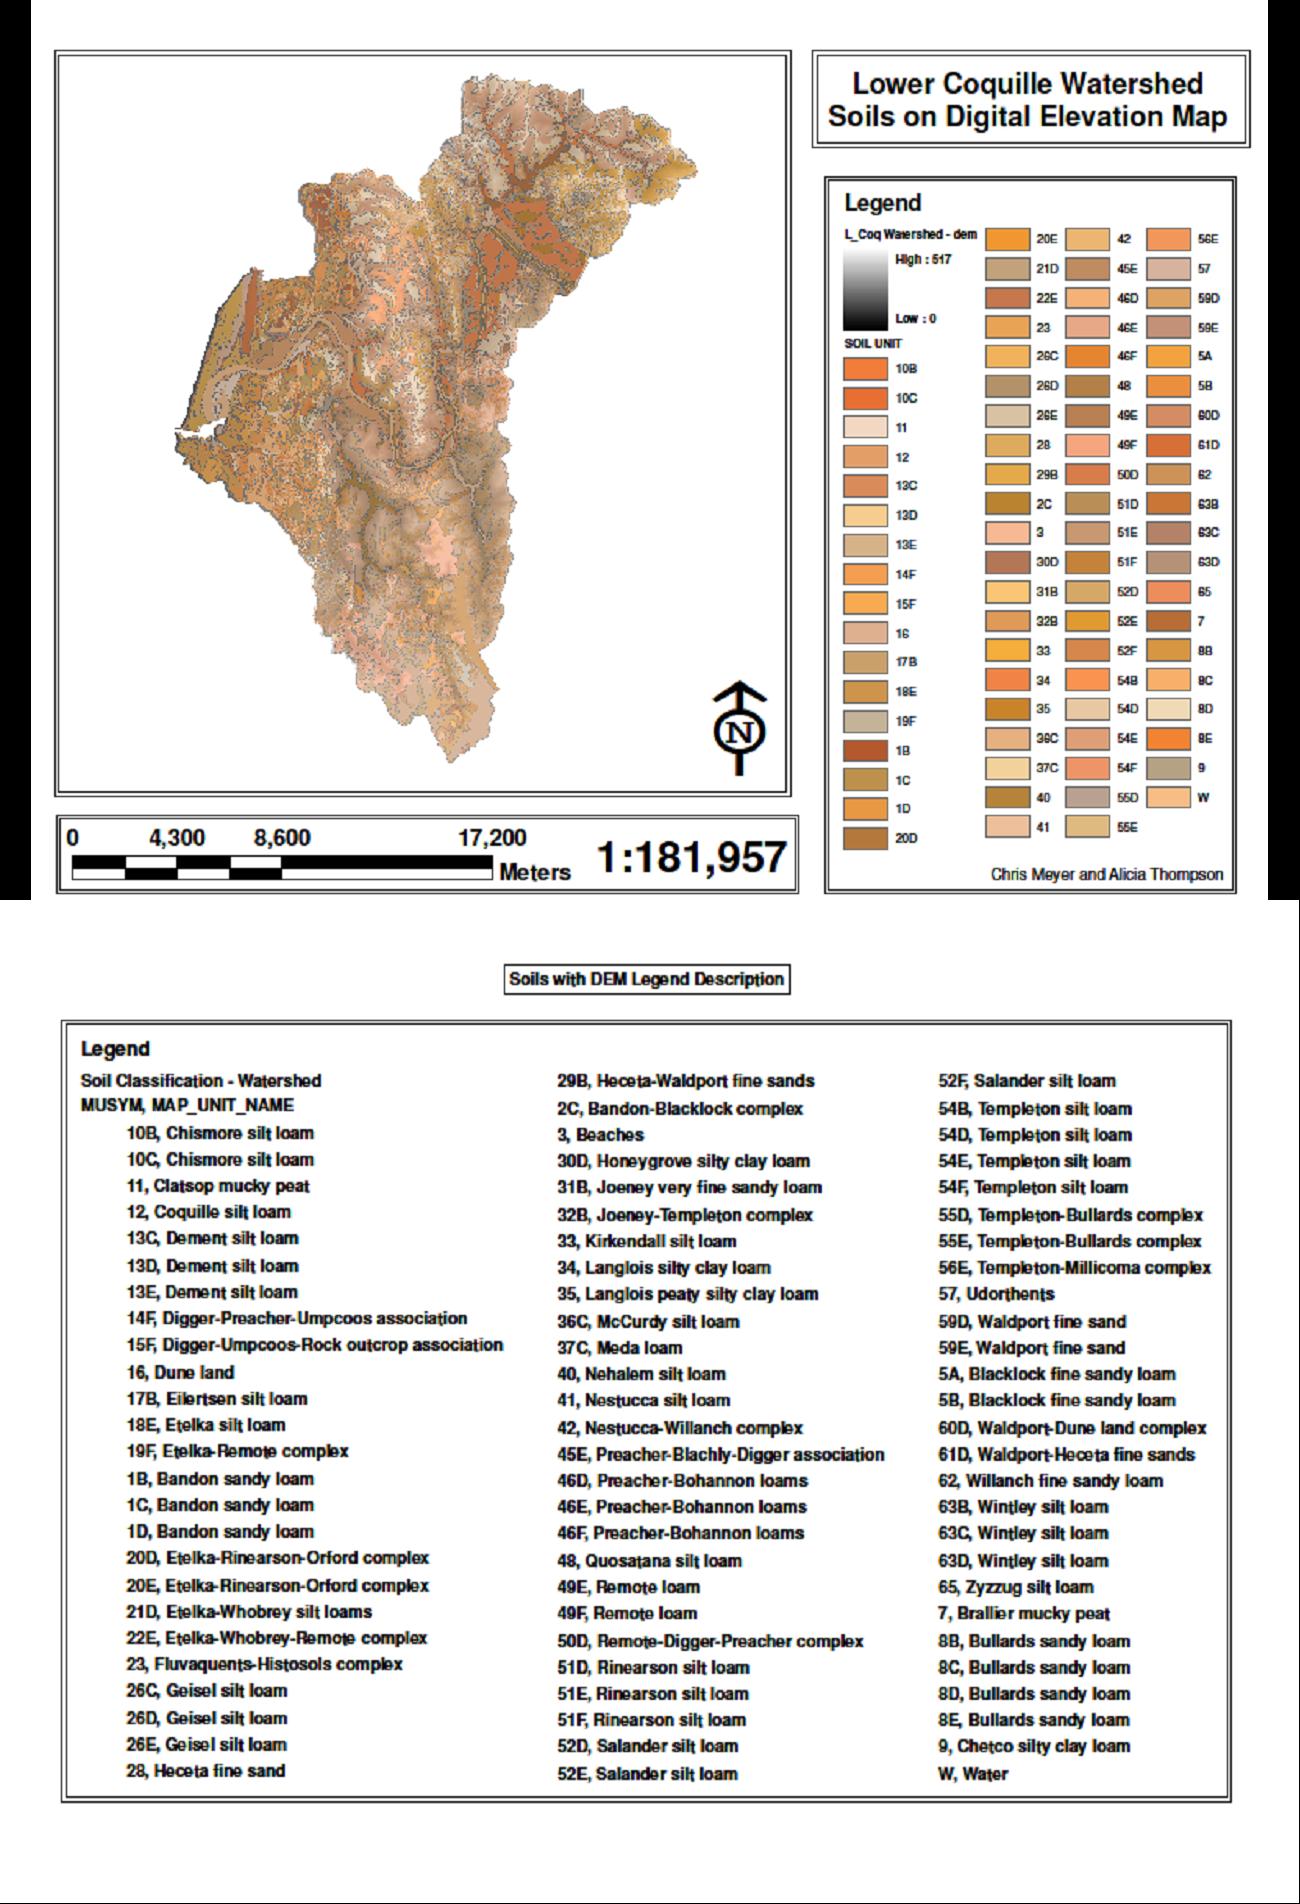
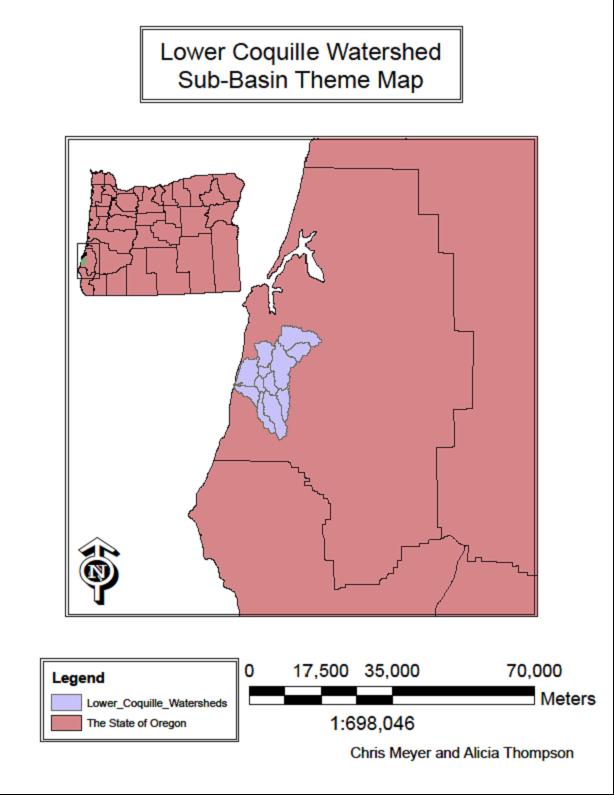
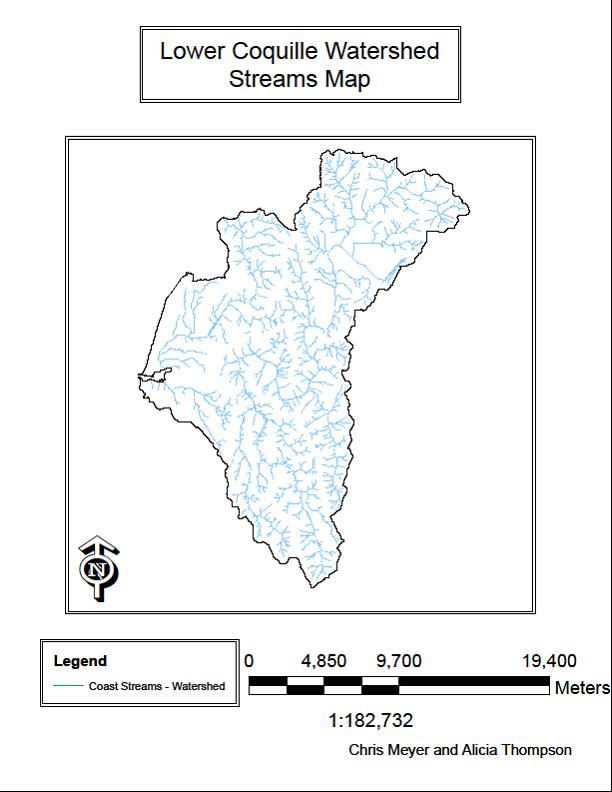
The Lower Coquille Watershed, part of the Coquille Basin is located in Southwest Oregon in Coos county. The Coquille River is the major river system which includes four stems: South Fork, Middle Fork, North Fork and East Fork. They join to become the Main Stem or Lower Coquille River.
|
|
   |
|
 |
  |
For More Information goto Dr. Taylor webpage and click on ES341 Fundamentals of Geographic Informations Systems