Historical Perspectives of Energy Consumption
Introduction
Without energy, life does not
exist. All forms of life extract energy from the environment and convert
it to forms which can be used. Our environment has three primary energy
sources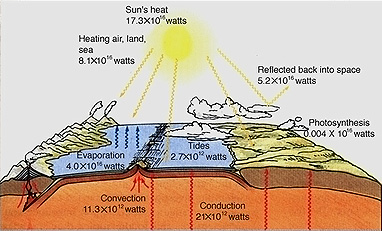
- Solar energy
- radiant energy
- 17.3 x 10¹⁶ watts
- energy the Earth's interior
- geothermal energy
- 32.3 x 10¹² watts
- planetary energy
- energy of gravitational attraction
- tides
- 2.7 x 10¹² watts
Source:http://ess.geology.ufl.edu/ess/Notes/020-Intro_ESS/Fig2.html
Humans convert energy from forms that are less desirable to those that are more desired i.e. from grass to meat, from wood to heat and from fossil fuels to electricity. Throughout history, man has developed ways to expand his ability to harvest energy. The primitive man found in East Africa 1,000,000 years ago, who had yet to discover fire, had access only to the food he ate so his daily energy consumption has been estimated at 2,000 Kcal or 2,000 dietary calories. Energy consumption of the hunting man found in Europe about 100,000 years ago was about 2.5 times that of the primitive man because he had better methods of acquiring food and also burned wood for both heating and cooking. Energy consumption increased again by almost 2.5 times as man evolved into the primitive agricultural man of about 5,000 years ago who harnessed draft animals to aid in growing crops. The advanced agricultural man of 1400 A.D. northwestern Europe again doubled the amount of energy consumption as he began inventing devices to tap the power of wind and water, began to utilize small amounts of coal for heating and harnessed animals to provide transportation. The dawn of the age of industrialization, ushered in by the invention of the steam engine, caused a 3-fold increase in energy consumption by 1875. Among other things, the steam engine allowed man to unlock the Earth's vast concentrated storage deposits of solar energy - coal, gas and oil so he no longer was limited to natural energy flows. Whereas increases in energy consumption had been gradual throughout history, once industrialization occurred, the rate of consumption increased dramatically over a period of just a few generations. The technological man of 1970 in the U.S. consumed approximately 230,000 Kcal of energy per day (~115 times that of primitive man) with about 26% of that amount being electrical energy. Of that electrical energy only about 10% resulted in useful work while the remaining 16% was wasted by inefficiencies in electrical generation and transmission. The change in energy consumption patterns over time are shown in Figure 1 below.
Figure 1. Estimated Daily Consumption of Energy
per Capita at Different Historical Points
Adapted from: E. Cook, "The Flow of Energy in an Industrial
Society" Scientific American, 1971 p. 135.
If you look at how energy sources have changed over time, you will notice that the age of industrialization and to an even greater extent the age of technology have accelerated the appearances and exploitation of new energy sources.
History of Energy Use in the United States
.The history of energy use in the U.S. stretches from the end of the advanced agricultural man era up to the modern technological man era. Wood was the predominant energy resource used in the U.S. until being replaced by coal in about 1885. The emergence of coal was fueled by westward expansion and the railroad. As railroads moved west away from the east coast and its abundant forests, they could no longer rely on wood to fuel their steam locomotives. Coal became the fuel of choice because it possessed higher energy content than wood and significant deposits could be found along the paths of the rail lines. In addition, iron and steel were needed to produce the rails and spikes needed. Coal proved an economical source of the coke need to produce the iron and steel. During the last half of the 19th Century the energy consumption for transportation and industry grew in a concerted fashion fueled by coal. Coal remained king until after World War II when petroleum surplanted it. The railroads switched to diesel locomotives and trucking fleets that used gasoline and diesel became the predominant form of goods transportation. Labor issues and safety standards which increased the costs of producing coal also played a role in coal's decline. However, coal fired electical generation allowed coal to remain an important energy resource.The emergence of petroleum and natural gas as predominant sources of energy followed an interesting pathway. These resources found little use for a number of decades after Edwin Drake's first successful drilling project. The use of petroleum began to increase in the 1920s, held steady during the depression and then increased dramatically until 1973, the time of oil embargos. No other energy source has ever shown such a meteoric rise in consumption as petroleum and natural gas. The changing picture of energy consumption by resource is shown in Figure 2.
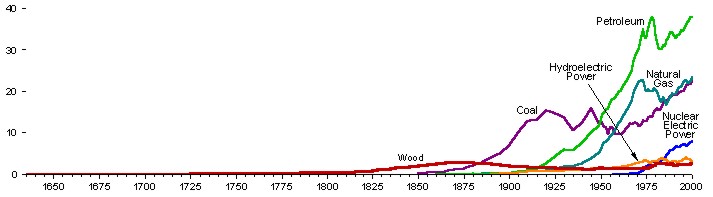
Figure 2. U.S. Energy Consumption
By Energy Resource 1635-2000 (in Quadrillion Btu)
Source: http://www.eia.doe.gov/emeu/aer/eh/intro.html
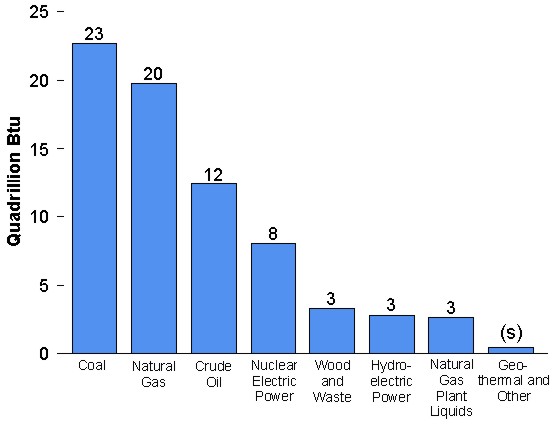
In the 1970's and 80's hydroelectric and nuclear resources began to become more important. By the year 2000, we had moved away from absolute predominance of one particular resource to a complex mix of fossil fuels, hydroelectric and nuclear resources although fossil fuels still far exceeded any other source. Figure 3 shows the role of different energy sources used for energy production in 2000.
(s)=<0.5 quadrillion Btu
Figure 3. U.S. Energy Production
by Source for 2000
Source: http://www.eia.doe.gov/emeu/aer/eh/total.html
The types of energy sources used
in residential and commercial applications has changed dramatically since
World War II (Figure 4). 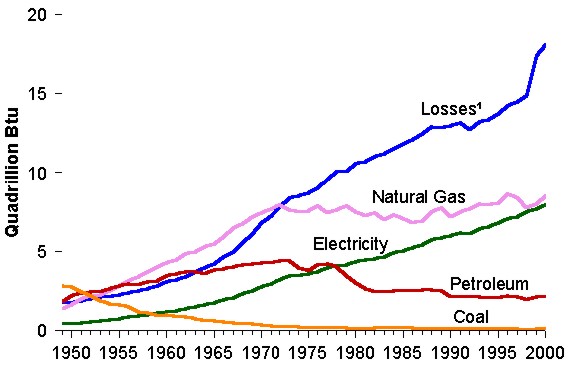 Until
1951 coal was still the predominant fuel. Petroleum and natural gas replaced
coal in the late 1950s. Petroleum use began to decline in the mid-1970s.
Electricity which was a token resource in 1950 has steadily increasedin
percentage due to a rising popularity for heating and the increasing number
of electrical appliances that are commonplace today. For example, 99%
of American households had at least one color television and almost half
had central air conditioning in 1997. In 1998, 42% of households had at
least one computer and by 2000 that percentage had risen to 51%.
Until
1951 coal was still the predominant fuel. Petroleum and natural gas replaced
coal in the late 1950s. Petroleum use began to decline in the mid-1970s.
Electricity which was a token resource in 1950 has steadily increasedin
percentage due to a rising popularity for heating and the increasing number
of electrical appliances that are commonplace today. For example, 99%
of American households had at least one color television and almost half
had central air conditioning in 1997. In 1998, 42% of households had at
least one computer and by 2000 that percentage had risen to 51%.
Figure 4. Residential and Commercial
Energy Consumption by Energy Source
1 Energy lost during electricity generation, transmission and
distribution
Source: http://www.eia.doe.gov/emeu/aer/eh/total.html
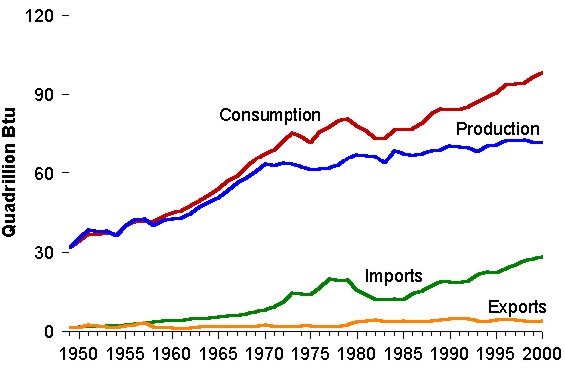
Until about 1958, the U.S. was largely self-sufficient in terms of energy, producing almost all the energy needed for consumption. However since that time, the gap between domestic production and consumption has continually widened as shown in Figure 5. Reliance on imported energy can have political ramifications.
Figure 5. Historical Comparision
of Energy Production and Consumption
Source: http://www.eia.doe.gov/emeu/aer/eh/total.html
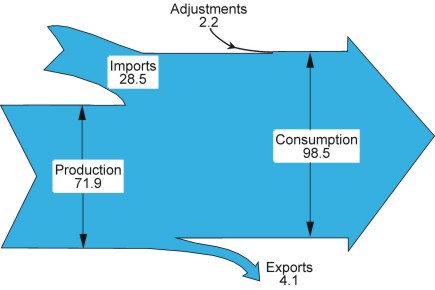
A summary for the year 2000 is shown to the right.
Source: http://www.eia.doe.gov/emeu/aer/eh/total.html
In 1973 the U.S. imported 6.3 million barrels of petroleum products (crude and refined). That amount increased to 11 million barrels in 2000.
Projections of energy consumption rates in the U.S. are shown in Figure 6.
Figure 6. Projected U.S. Energy Consumption
to 2025
http://www.dallasfed.org/research/swe/2003/swe0305b.html
World-wide Energy Consumption
The success of an industrial society i.e., the growth of its economy, the quality of the life-style of the population and the society's impact on the environment, is a function of the quantities and types of energy resources it exploits and the efficiency with which it converts potential energy into work and heat. Increasing energy consumption closely matches societal modernization.
Figure 7 shows that during the period 1980 -2002, North America was the greatest consumer of energy in the world. The two regions that show the greatest change over that period are Asia and Eastern Europe and the former Soviet Union. While Asia's energy consumption has increased dramatically, that of Eastern Europe and the former Soviet Union has declined.
Figure 7. Percentage of World Energy Consumption
By Region 1980-2002
Data obtained from the Energy Information Administration
Figures 8 shows the percentages of the total global energy consumptions for of these regions in 1980, 1990 and 2000 .
Figure 8. Percentage of total
Energy Consumption By Region in Select Years
Data obtained from the Energy Information Administration
|
|
|
Investigate how energy consumption relates to standard of living by comparing energy consumption statistics with either Gross National Product (GNP) or Gross Domestic Product (GDP)for the following:
You can access a spreadsheet of energy
consumption statistics here.
|