Oil |
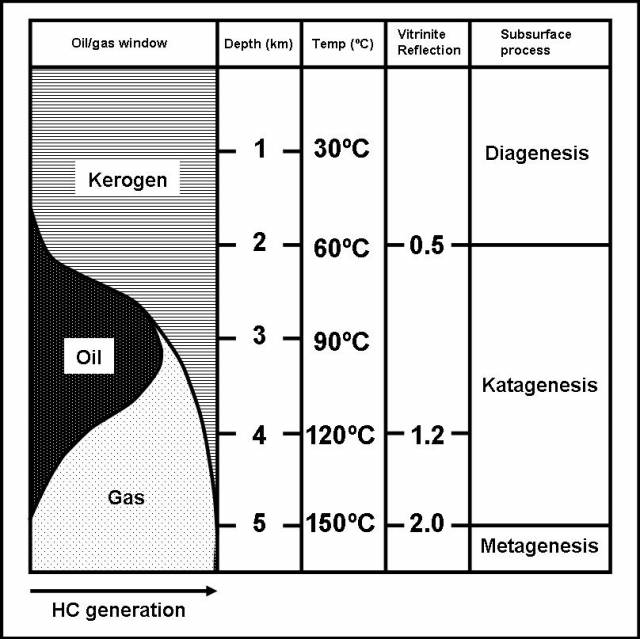 This cracking process continues until the accumulated sedimentary rock exerts enough pressure for the temperature to reach about 120 oC. The 60-120 oC temperature range is called the "oil window". Below this window, oil does not form. As the thickening rock layer causes the temperature to rise above 120 oC, the cracking process begins to break the oil hydrocarbons into smaller and smaller molecules. At about 150 oC, only the smallest hydrocarbon methane or natural gas (CH4) remains. Temperatures between 100-200 o, the "gas window", form methane.
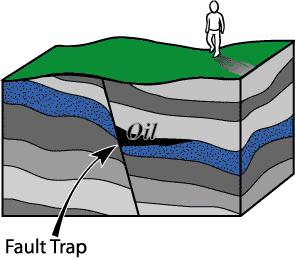
The sedimentary rock layers above the hydrocarbon forming region are porous like a sponge. As the rock layer increases in depth, the compaction begins to "squeeze" the hydrocarbons out of the matrix they are in. Since they are not very dense, they tend to perculate upwards via pores in the rock and cracks in the layers. They will continue their upward movement until they encounter an impermeable layer of rock which serves as a trap. The migrating hydrocarbons accumulate into a pool of oil.
This cracking process continues until the accumulated sedimentary rock exerts enough pressure for the temperature to reach about 120 oC. The 60-120 oC temperature range is called the "oil window". Below this window, oil does not form. As the thickening rock layer causes the temperature to rise above 120 oC, the cracking process begins to break the oil hydrocarbons into smaller and smaller molecules. At about 150 oC, only the smallest hydrocarbon methane or natural gas (CH4) remains. Temperatures between 100-200 o, the "gas window", form methane.
The sedimentary rock layers above the hydrocarbon forming region are porous like a sponge. As the rock layer increases in depth, the compaction begins to "squeeze" the hydrocarbons out of the matrix they are in. Since they are not very dense, they tend to perculate upwards via pores in the rock and cracks in the layers. They will continue their upward movement until they encounter an impermeable layer of rock which serves as a trap. The migrating hydrocarbons accumulate into a pool of oil. .jpg) |
 |
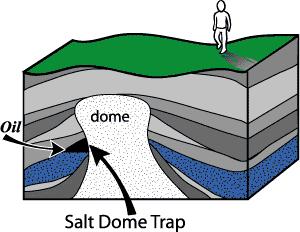 |
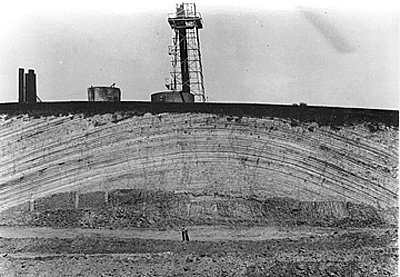
The anticline trap as seen in this photo is the most common of these traps.
 http://www.fas.org/irp/imint/docs/rst/Sect5/Sect5_5.html
Watch this origin of oil animation to see the entire process.
![]()
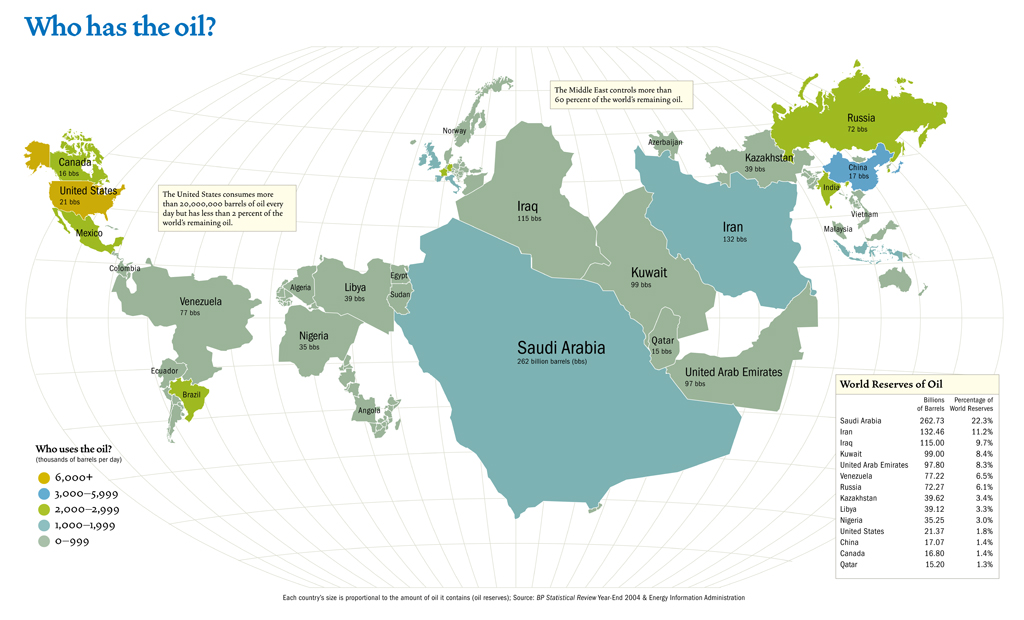
Why Is Oil Concentrated In Specific Geographical Locations?
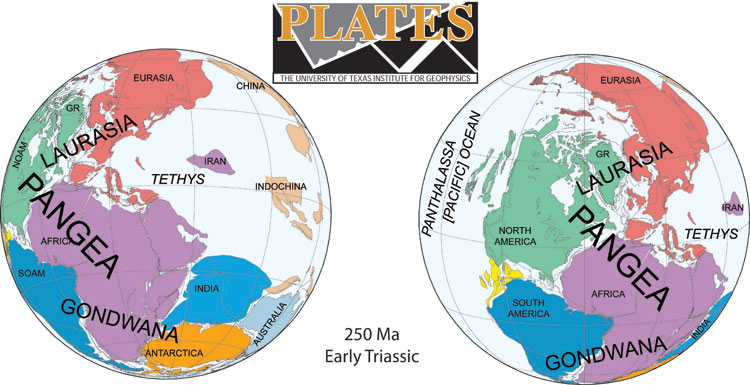
Looking at the map above, you can see that the largest oil reserves are in the geographical region often referred to as the Middle East but did you know that not all countries in this region are oil rich? In fact Afghanistan, Israel, Jordan and Lebanon are some of the dozen nations in the greater middle east that are "oil dry". So what makes countries like Saudi Arabia and Iran oil rich while making Jordan, Israel and Afghanistan oil poor? To answer this question we need to start back more than 250 million years ago when the earth's land masses were fused together into a supercontinent called Pangea.
Image modified from http://geology.rutgers.edu/103web/Pangeabreakup/breakupframe.html

Note in the image to the left that the land mass ancestral to Saudi Arabia was located at the equator.
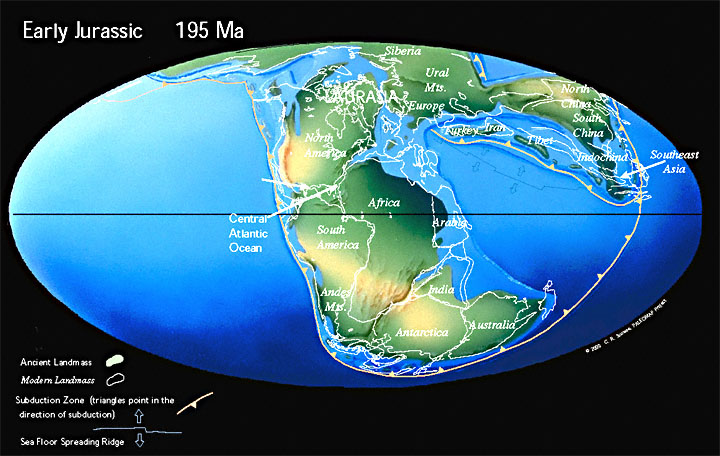
The earth's surface is like a giant jigsaw puzzle whose pieces (known as tectonic plates) move like rafts on the heat currents of the molten interior. As background material, watch this video on the topic of plate tectonics . As geologic time progressed(click here to open a geologic timeline graphic), the movement of the plates caused this supercontinent to break apart. Ancestral Saudi Arabia was bordered by a warm shallow sea called the Tethys Sea which provided a perfect environment for the growth of large quantities of tiny organisms such as diatoms and plankton. Note the position of ancestral Saudi Arabia (on the Arabian plate) and Iran in the diagram below (India's position is also interesting).
As geologic time progressed, the Atlantic Ocean widened separating South America from Africa while plate rotation slammed India into Asia and the Arabian plate into the ancestral Iran. View this animation showing how plate movements transformed Pangea into the Earth's surface as we know it today. Below are a series of images showing points along the progression.
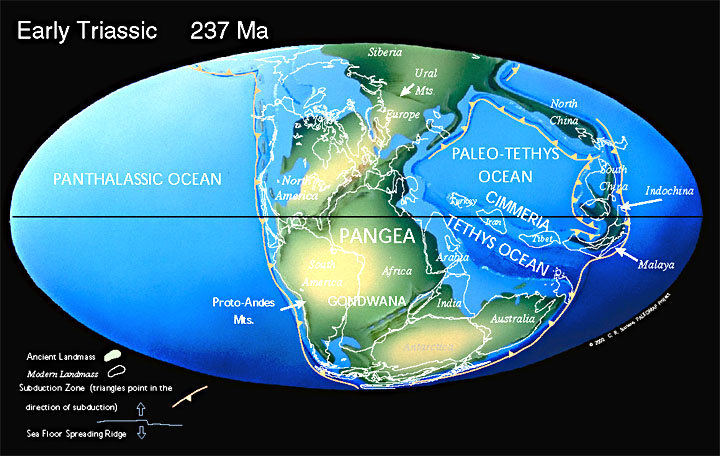 |
During the Early Triassic, the eastern portion of crust that is now part of Saudi Arabia was oceanic crust covered by warm shallow sea water and all of Iran was oceanic crust. |
 |
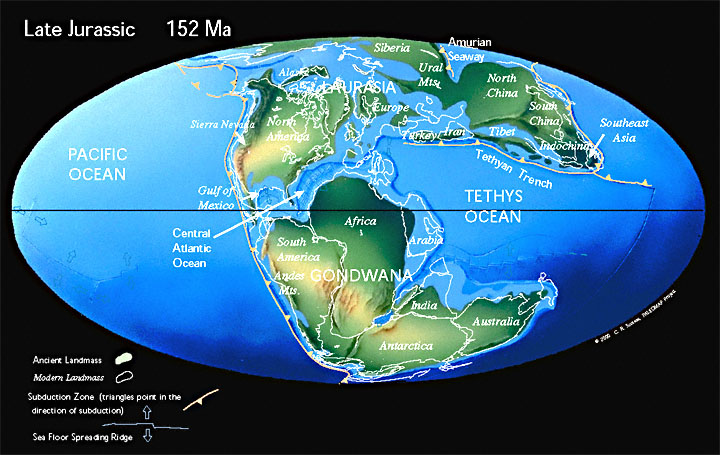
From the Jurassic through the Cretaceous, Saudi Arabia was equitorial. The shallow coastal waters provided optimal conditions for coral reef formation. These reefs are carbonate rock formations created from the skeletal remains of marine species. The land was arid and being close to the equator, there was a high rate of evaporation of the sea water which allowed precipitation of salts such as sodium chloride, calcium sulfate, and calcium carbonate (called evaporites). When these evaporites are deposited on a reef, they form an excellent seal trapping any hydrocarbons that form in the porous carbonate reef rock. |
 |
|
 |
|
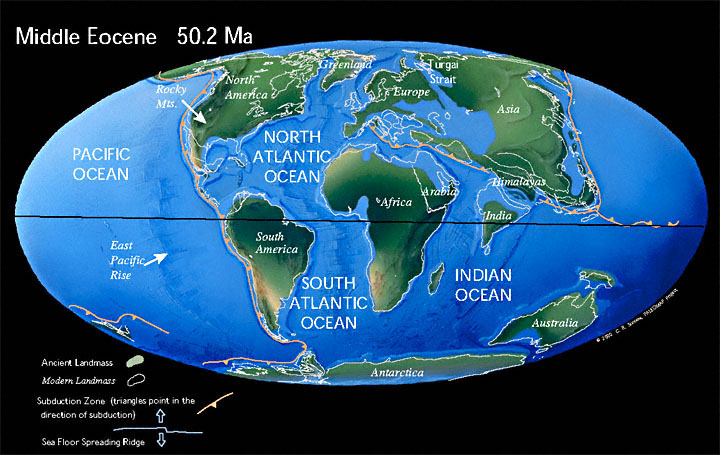 |
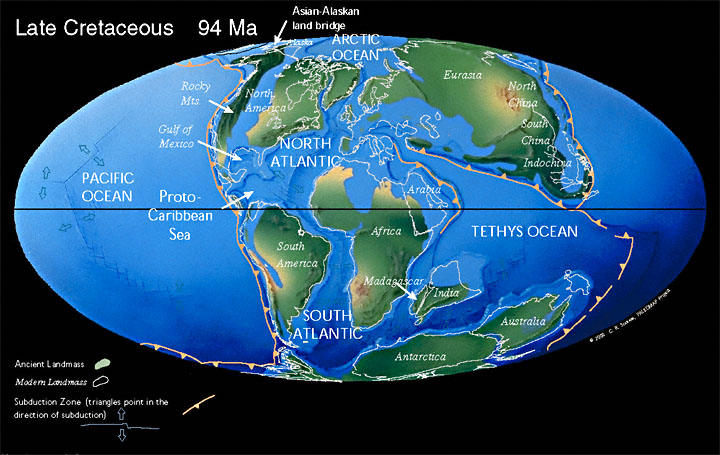
Through the Middle Eocene much of Saudi Arabia was still covered by a shallow sea. Throughout geologic time, sediments washed from river deltas into the shallow seas increasing the dry land mass in the form of sedimentary rocks. By the Middle Eocene, the Arabian plate is on a collision course with the land mass of Iran. |
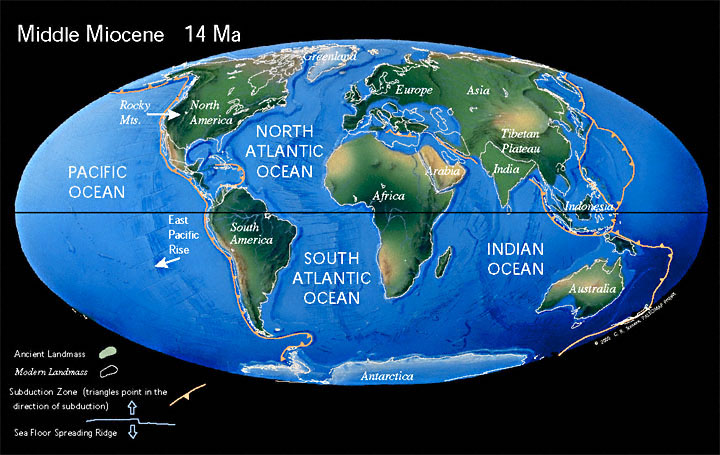 |
By the Middle Miocene the Arabian plate was subducting under the Iranian region of the Eurasian plate. Note the orange boundary of the subduction zone. The triangles indicate the direction of subduction. |
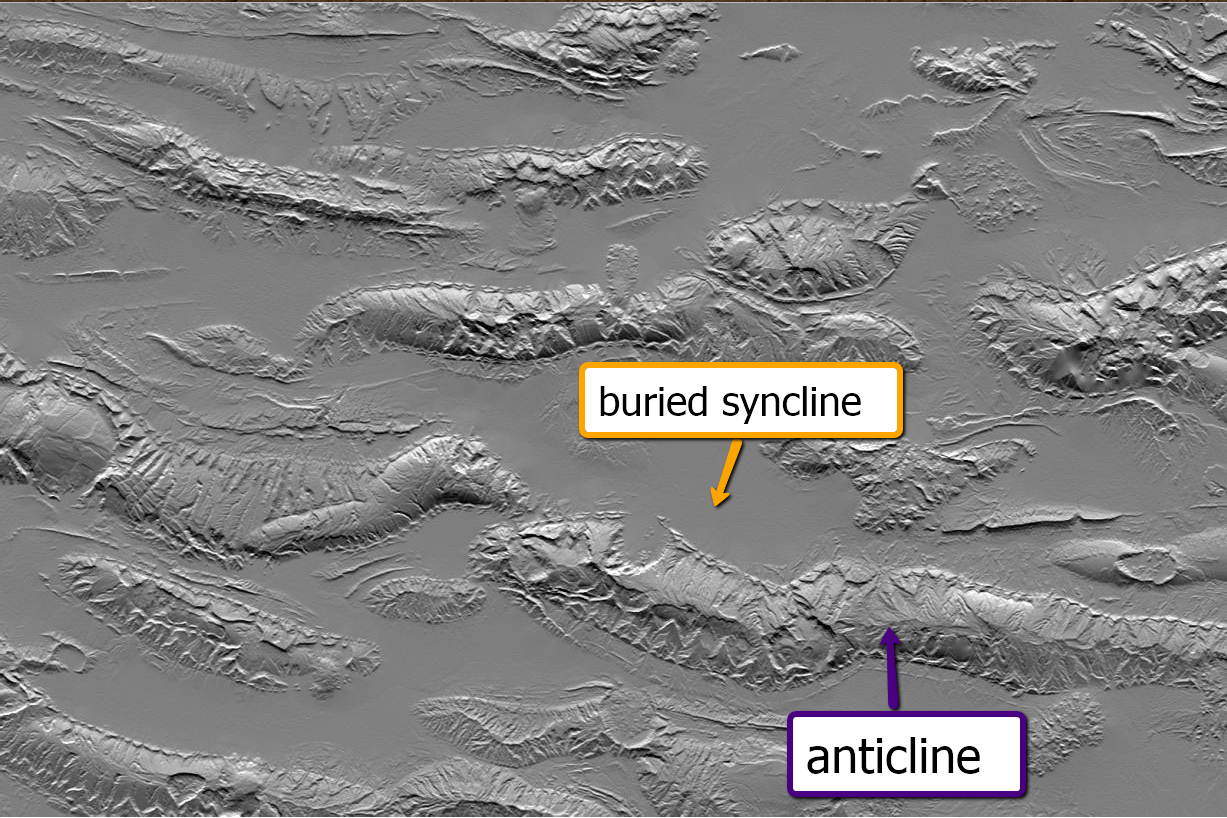
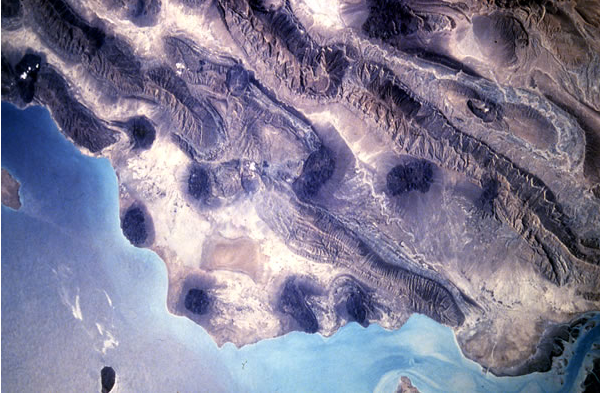
The Zagros Mountains in southwestern Iran were formed by collision of the two plates which caused extensive folding of the preexisting layered sedimentary rocks much like a carpet folds when pushed as demonstrated in the plate tectonic video above. The convex upward folds are called anticlines and downward folds separating the anticlines are called synclines. The synclines are largely filled by sediments eroding off the anticlines so they are not obvious as concave structures in the satellite photo.
Photo courtesy of NASA/JPL
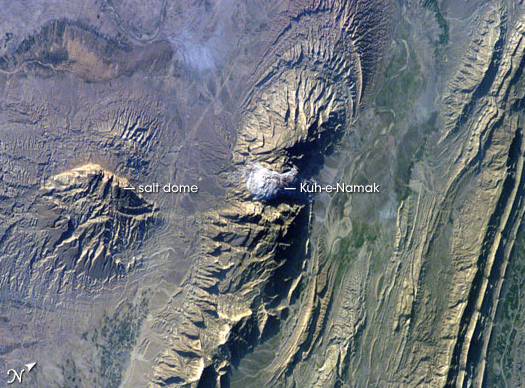
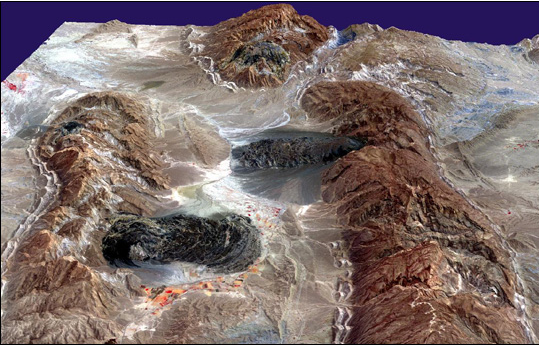
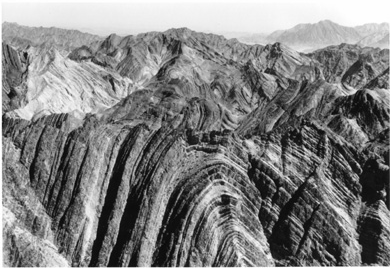
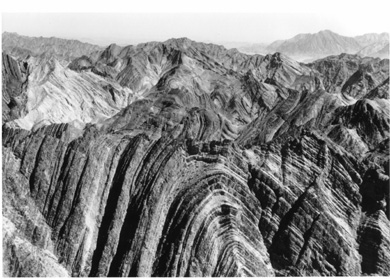
Another satellite image (top left) of a portion of the Zagros Mountains shows the presence of salt deposits in the form of a lava dome (Kuh-e-Namak or “mountain of salt” in Farsi; bottom left photo shows anticlines with the dark spots being salt domes). These salt deposits probably resulted from the evaporation of a shallow possibly inland sea (maybe not unlike the Great Salt Lake). These salts, buried by the sediments, exist as layers within the anticlines and synclines. Since salt is less dense than most other types of sedimentary rocks, it tends to migrate upward in vertical columns as salt plugs called "diapirs". If the diapirs reach the surface, the salt comes out in flows not unlike volcanic lava flows (top right). The photo on the bottom right clearly shows the deformation of the rock layers in a Zagros anticline.
Images courtesy of NASA's Earth Observatory
| image from http://www.parstimes.com/spaceimages/zagros_anticlines.jpg |
All of these geological features give clues that the region was an ideal candidate for the development of petroleum. The map of the Middle East oil corridor shows that the positioning of the major oil producing area coincides with the margins of interaction of the Arabian and Eurasian tectonic plates while the non-oil producing areas were not part of a convergent subduction zone.
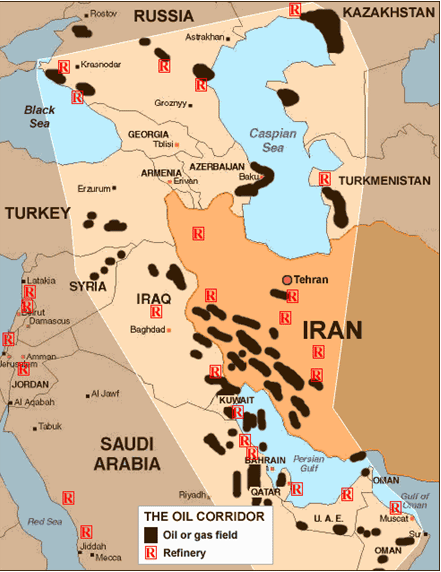
So being in the right place at the right time, in geologic time that is, determined who has the oil and who doesn't!
![]()
Types and Classifications of Crude Oil
Crude oils contain hundreds of different molecules, and their compositions vary widely from one geographic location to another. The quality of the crude is largely a function of its maturation (not unlike the quality of coal). The color which can range from light yellow through green to almost black is usually indicative of the types of properties the crude will have.
photo source: https://courseware.e-education.psu.edu/courses/egee101/L05_petroleum/L05_quality.html
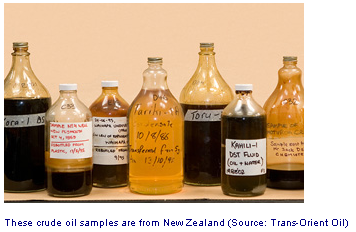 The lighter the color of the crude, the greater is its maturation; the smaller the average number of carbon atoms in the hydrocarbon molecules are; and the more profitable it will be since less processing is needed to convert it into a desirable fuel source. Younger crudes tend to have greater percentages of large molecular weight molecules.
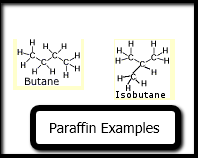
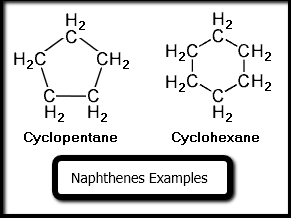
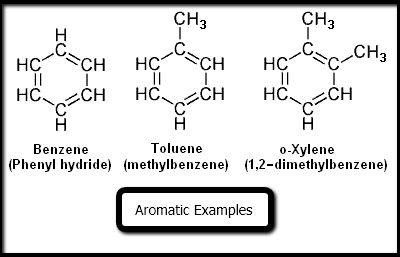
Crudes are composed primarily of hydrocarbons with small amounts of other nitrogen, oxygen or sulfur containing organic compunds. They also may contain traces of metallic elements such as iron, nickel, copper or vanadium. The hydrocarbons compounds in crude oil fall into four classifications: paraffins (straight and branched-chain alkanes), naphthenes (cycloalkenes) aromatics (contain benzene rings) and asphaltics (complex molecules of high molecular weight often larger than 1000g/mol).
http://geochemist.wordpress.com/2009/01/08/evolusi-termal-material-organik-2/
There are several different systems used for classifying crude oils. Crude oils are divided into types by their American Petroleum Institute (or API) gravities which are based on the physical property of density. The API system compares the density of the crude oil to water. When you compare the numerical densities of two liquids, you get a number called the specific gravity. If the specific gravity is equal to 1, the two liquids have the same density. If the specific gravity is greater than 1, the crude oil would be less dense than water and floats. If the specific gravity is less than 1, the crude is more dense than water and sinks. The API gravity value is obtained from specific gravity (measured at 60 degrees) by the equation:
API = (141.5 ÷specific gravity) - 131.5
Most crude oils have API gravity values in the range 10-70 API degrees. The higher the API gravity value, the less dense the crude; the greater the percentage of lower molecular weight hydrocarbons; the more mature the mixture and the more economically valuable it is. Crude oils are divided into light, medium or heavy, based on API gravity. The greater the API density (expressed in degrees), the more dense the crude oil. If the API is 10, the specific gravity (the term used when you are comparing the densities of two liquids) is equal to 1, and the water and oil have the same densities. API gravities greater than 10 indicate that the crude is less dense than water and floats while APIs less than 10 would indicate a crude oil that is more dense than water which sinks. Most oils fall into the range of 10-70 API degrees.
| Light | API 38 or above | |
| Medium | API between 22 and 38 | |
| Heavy | API 22 or less | |
| Extra Heavy (bitumen) | API 10 or less (sinks) |
This video shows the difference between crude oil samples of different types, one is a Pennsylvania crude and the other is from the Gulf of Mexico.
https://courseware.e-education.psu.edu/courses/egee101/movies/
Viscosity is another way to see the differences between these two crude oil samples. By definition, viscosity is a measure of a fluid's resistance to flowing. Materials that flow freely have low values of viscosity while those that flow slowly will have large viscosities. Light, high quality crude oils possess low viscosities (and high API gravities). Heavy, lower quality crudes possess larger viscosities. Crudes that do not flow at normal temperatures or without dilution are termed bitumen and have API gravity values less than 10. The crude that is found in the Athabascan oil sands of northern Alberta is an example of bitumen which must be processed to generate a viable product known as synthetic crude oil.
This video that shows the different flow characteristics of the Pennsylvania and Gulf samples.
https://courseware.e-education.psu.edu/courses/egee101/movies/
Crude oils can be divided into two categories, sweet or sour depending on sulfur content. A sweet crude has less than 0.5% sulfur while a sour crude has a sulfur content greater than 0.5%. The quality of a crude oil is described by both its viscosity and its sulfur content. The most prized, and therefore most expensive, crude oils are those that are sweet and light. It is much more expensive to convert heavy sour oils into desirable products.
When hydrocarbons are burned in the presence of oxygen (a reaction called combustion), the carbons atoms are converted into CO2 and the hydrogens into water. During the combustion reaction, any sulfur present is converted into SO2 (sulfur dioxide) which, when combined with water, forms sulfuric acid (a component of acid rain). In an effort to reduce the amount of atmospheric acid that is introduced from transportation sources, the EPA has lowered the limit of sulfur allowable in refined petroleum products. The removal of excess sulfur from sour oils adds an additional processing step which increases the cost of converting the crude into usable products. Sulfur is removed by a process called hydrotreating in which it is reacted with hydrogen. The hydrogen sulfide produced can be separated from the hydrocarbon mixture which can be refined into desired products.
![]()
What Drives the Cost of Gasoline?

Gasoline, diesel and aviation fuels are among the most important products obtained from crude oil. The relative amounts of these products obtained from a given barrel of crude oil are determined by the quality of the crude itself. Light sweet crudes are the best sources of gasoline and other fuels used for transportation applications. The cost of a barrel of oil will reflect the quality of the crude. For buying and selling purposes, the quality of a particular crude oil is compared to a reference or benchmark crude for which a particular price has been set. For example, Brent Blend is a combination crude made from the oil fields of the North Sea. It is a light sweet oil (API~38;sulfur ~0.4%) excellent for gasoline production. Other crudes from Europe and some areas of Africa are compared in quality to Brent Blend and priced accordingly. A barrel of crude having slightly lower quality might sell for the Brent Blend price minus $0.50. Most oil transactions in the U.S. use a mixture called West Texas Intermediate (WTI) as a benchmark. WTI is lighter and sweeter than Brent Blend (API ~ 40; sulfur ~0.3%. WTI typically sells for $1-2 more per barrel than Brent. Read more about differences among various types of crude oil and pricing here. The prices for Brent Blend and WTI are determined by the OPEC Basket price. The OPEC Basket is determined using crudes from Algeria, Indonesia, Nigeria, Saudi Arabia, Dubai, Venezuela and Mexico. The oil from some of these regions are heavier and more sour making them economically less valuable than those of the Brent Blend or WTI, thus these crudes command a premium. The price and price differentials between different crudes reflect the relative ease with which they will be refined.
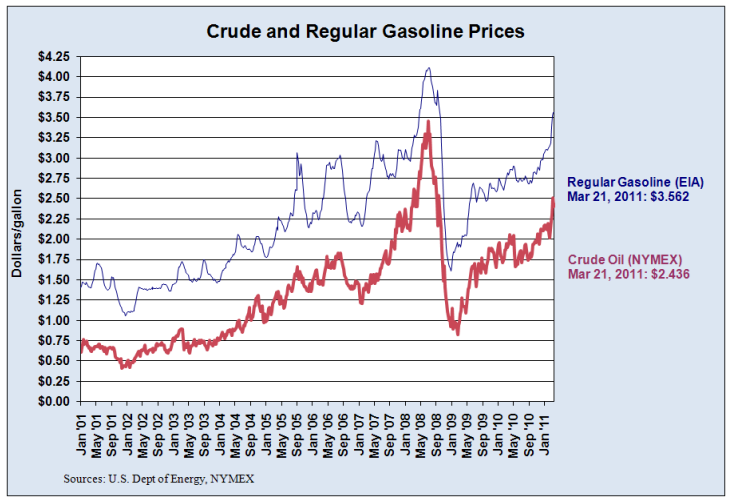
The above graph shows a general trend of increasing gasoline prices at the pump from 2001 to 2011 that mirrors the increasing cost of crude oil during that timeframe. One of the factors contributing to this increasing trend in crude oil prices is the declining production of light sweet oils. A large amount of known light sweet resources have already been harvested and much of the crude being produced is of lower quality. Thus, dwindling supply of high quality crude and increasing demand of premium products such as gasoline, cause prices to steadily increase.
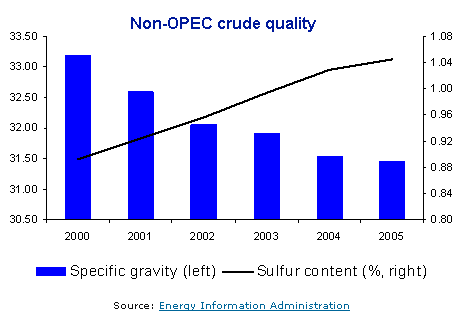
The decreasing quality of crude oil from 2000 to 2005 can be seen in the graph above on the left where the API steadily decreased and the sulfur content increased.
 source: U.S. Energy Information Administration
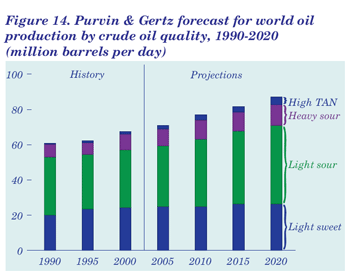
The quality of crude imported into the United States has declined over the last two decades (API ~32.5 in 1990 to ~30.2). In 1990 high TAN-crudes were not being imported. TAN is an abbreviation for total acid number which is a measure of the acidity and, therefore, corrosiveness of the crude. The higher the TAN number, the more corrosive the crude. This corrosiveness is important because corrosive materials damage the pipes of refineries leading to increased maintenance costs for crude oil processors. The graph above demonstrates that while oil production has increased to meet growing demand, the percentage of light sweet oil produced in the total supply has declined.
 Obviously the more expensive the crude oil, the more a gallon of gasoline made from it is going to cost at the pump. However, the cost of the crude is only a part of the cost of that gallon of gasoline. The EIA graphic on the left shows the breakdown of the cost components of a gallon of gasoline while the graphic to the right shows the same breakdown for a gallon of diesel. The graphs below show recent national and regional price trends.
Although motorists in the U.S. complain about the cost of motor fuels, gasoline is really not as expensive per gallon as many other commodies that they purchase. For example, a gallon of Coca-Cola costs about $3.84, Starbucks coffee $32, and Dom Perignon $755.
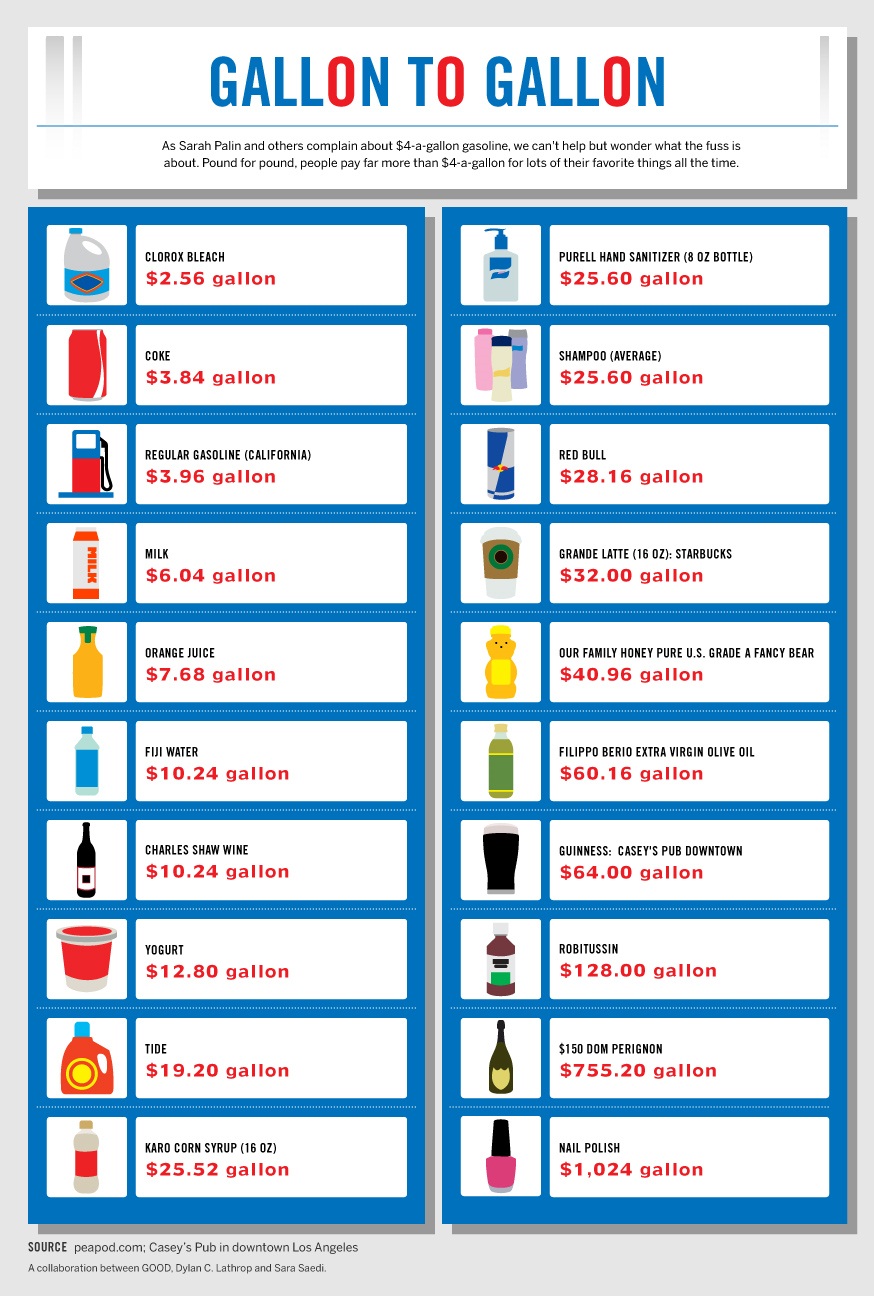
http://awesome.good.is/transparency/web/1103/gas-comparison/flat.html
![]()
Processing the Crude Oil
Once crude oil is pumped from its underground reservoir, it is transported to a refinery where it separated into mixtures of hydrocarbons of different molecular size. Each of these mixtures will be suited to a particular use. The first stage of the refining process uses the physical property of boiling point to separate the crude into the different mixtures using a technique called distillation.
Watch this video to learn about the distillation technique:
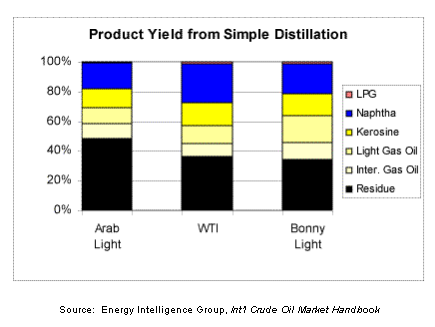
The amount of each of the fractions obtained from the distillation is related to the quality of the original crude oil. The lighter the oil is, the greater will be the amount of the type of molecules that are appropriate for transportation fuel uses obtained in a distillation.
Often the amount of a fraction, such as that which can be used for gasoline, is not adequate for the demand of the product or too much of a product of little commercial utility is obtained. The fractions obtained from the distillation stage are chemically processed converting the molecules of one size into molecules of a different size. Watch the video below showing the refining process.
One 42 gallon barrel of oil yields approximately 19 gallons of gasoline, 9 gallons of diesel, as well as propane and jet fuel. The plastics that are so ubiquitous in our society come from petroleum. Even if we reverted to a plastic-less world and didn't drive cars or used other forms of transportation based on combustion engines, we still would need petroleum for production of many other things. We live in a petroleum-based society. Without it we would not have toothpaste, contact lenses, or detergent. In fact the remainder of that barrel of oil provides hydrocarbon feedstocks for making over 6000 other products. Click here to see a partial list of products that are derived from petroleum. Were you surprised by some of the items on that list?
![]()
As you can see there is a little more to the oil story than..........................
The Original Beverly Hillbillies Theme Song from Dakotas UMC on Vimeo.
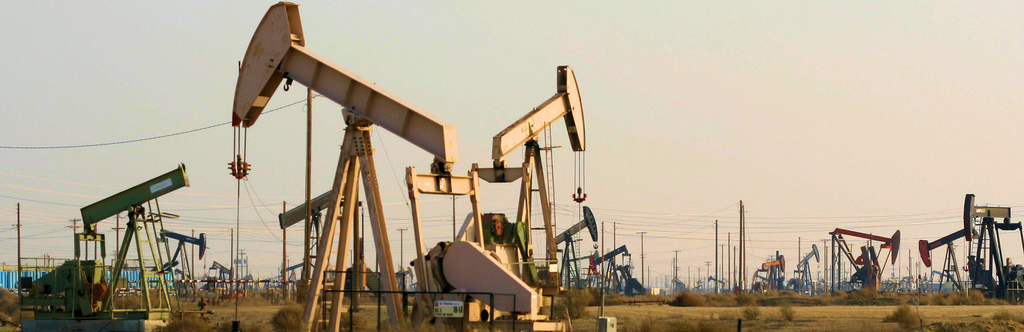
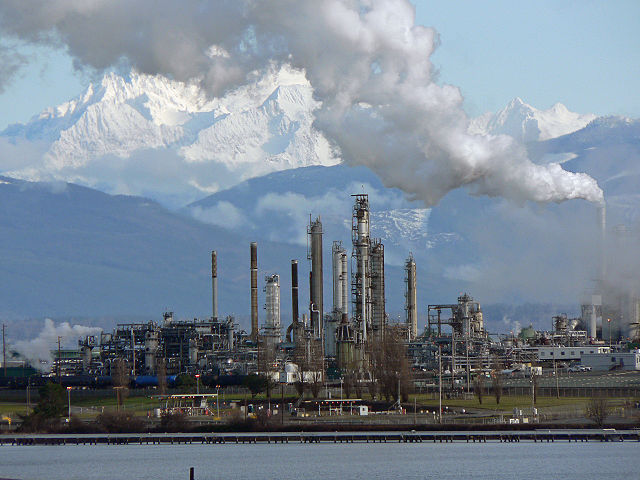
Title photo of oil wells from: http://www.flickr.com/photos/bike/3153652073/
Last modified 14 November 2019